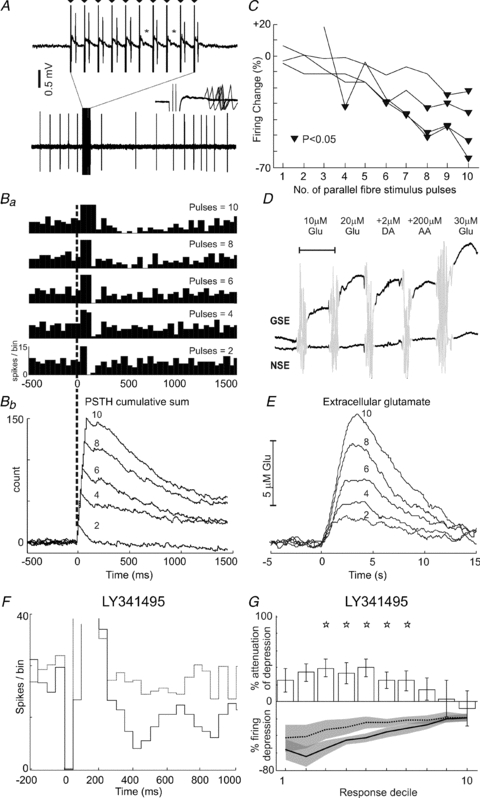
Figure 2. Direct parallel fibre stimulation inhibits Golgi cells via mGluR2.

Raw data in A show a 2.5 s excerpt from an example Golgi cell recording during parallel fibre stimulation (10 pulses, 100 Hz). Note the prolonged depression of firing that follows the stimulus train. The stimulation period is expanded (upper records) to show individual stimulus artefacts (indicated by triangles, 10 ms intervals). Note the failure to evoke a short-latency spike (indicated by *) following pulses 6 and 8 of the train. Inset shows a 5 ms period following the same pulses – note the ‘jitter’ of the evoked spikes, indicating their synaptic origin. Ba and Bb illustrate PSTHs (15 trials for each case, bin-size 50ms; y-axes are truncated to focus on depression responses at the expense of early excitations) and CUSUMs (bin-size 5ms) of the response of the same Golgi cell to trains of 10, 8, 6, 4 and 2 parallel fibre stimuli at 100 Hz. The prolonged firing depressions diminish in ‘strength’ with decreasing numbers of stimuli, also indicated by the decreasing downward gradients in the CUSUMs. C shows grouped data for 4 different Golgi cells tested in the same way comparing the ‘strength’ of firing depression with number of stimuli. Triangles indicate points of significant firing depressions. D shows pre-implantation calibration data for a glutamate-sensitive electrode used to measure changes in ambient glutamate levels following parallel fibre stimulation. Only the glutamate-sensing electrode (GSE) is designed to sense glutamate; note the stepwise response to increasing glutamate (Glu) concentrations. Note the lack of response of the electrode lacking glutamate oxidase (NSE). Neither electrode responds to the electroactive species dopamine (DA) or ascorbic acid (AA). Scale bar, 100 s; mixing artefacts are greyed-out. E, data from the same glutamate-sensing electrode following local parallel fibre stimulation using the same stimulus protocols as for Golgi cells (superimposed numbers indicate stimulus train length). Mirroring the firing depressions in Golgi cells, peak levels of ambient glutamate decrease in line with shorter parallel fibre trains. F, PSTHs showing the responses of an example Golgi cell to parallel fibre stimulation (10 pulses, 100 Hz) before and after LY341495 application (continuous and dashed lines, respectively). In this example, stimulus artefacts (zero bins 0–90 ms) obscured recording during the train. Parallel fibre stimulation produces a pronounced excitation followed by a prolonged depression in firing (continuous line). Following application of LY341495 to block mGluR2, the prolonged depression was substantially attenuated (dashed line) – note that PSTH is scaled to optimise the evoked depression response. Grouped data for eight Golgi cells tested in this way are plotted in G, which shows significant attenuation of the evoked depression across deciles 3–7 (indicated by stars).
