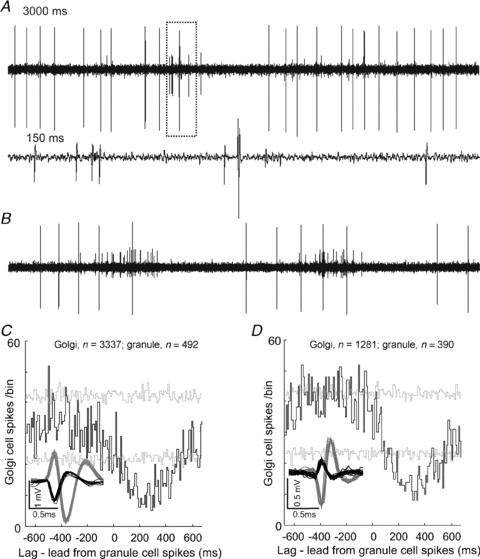
Figure 4. Cross-correlation analysis of Golgi–granule cell pairs.

A shows a 3 s excerpt of raw data from a double-unit recording of a Golgi cell (large spikes) and a granule cell. Notice the irregular activity pattern of the granule cell, particularly evident in the expanded section (dotted box and lower trace), representing 150 ms of data. Similar raw data for a different Golgi cell–granule cell pair are drawn in B. The cross-correlograms shown in C and D are derived from the paired recordings shown in A and B, respectively (bin-size 10 ms), and each plots Golgi cell activity with respect to granule cell spiking (numbers of spikes used from each cell indicated above each correlogram). Broken grey lines represent 95% confidence interval for the ‘shift predictor’ (calculated using 100 iterations of randomised spike train time-shifts). Note the significant (P < 0.05, i.e. cross-correlation bins exceeding the ‘shift predictor’ confidence interval) depressions in Golgi cell firing that follow granule cell spiking which are also evident in the selected raw data shown in A and B.
