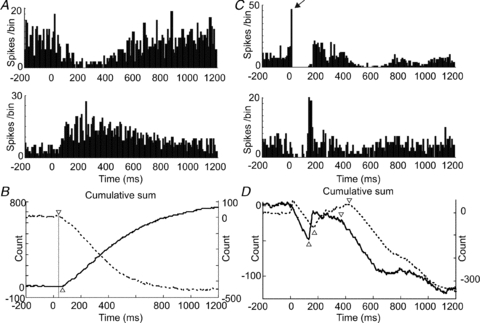
Figure 5. Comparison of the responses of Golgi cells and granule cells to sensory afferent stimulation.

A shows PSTHs (bin-size 10 ms) for a Golgi cell–granule cell pair following stimulation of ipsilateral hindlimb afferents. The Golgi cell (upper panel) shows a typical long-lasting depression (LLD), whilst the granule cell shows a delayed onset long-lasting excitation (LLE). The CUSUMs in B show more clearly the time-course of these responses (Golgi cell, dashed line); triangles indicate onset latencies. The PSTHs (bin-size 10 ms) shown in C plot data from two simultaneously recorded granule cells (different electrodes) following stimulation of contralateral trigeminal inputs. In these examples, the cell in the upper panel shows both early (indicated by arrow) and late excitations (SLE and LLE), whereas the cell in the lower panel shows an LLE without SLE. The responses of both cells are interspersed with periods of early and late depression below spontaneous firing levels, seen more clearly as downward deflections in the CUSUMs plotted in D (upper cell, dashed line). Downward trends in the lines represent periods of reduced firing, relative to pre-stimulus levels; LLE onsets and offsets are indicated by upward and downward facing triangles, respectively.
