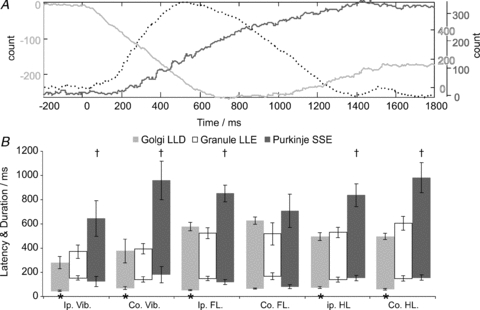
Figure 8. Relationship of Golgi and granule cell activity to Purkinje cell firing.

The CUSUMs plotted in A show the combined responses from a simultaneous ensemble recording involving a Golgi–granule pair and Purkinje cell ∼600 μm away, following stimulation of ipsilateral hindlimb afferents. In this example, the Golgi cell (light grey line) shows a long-lasting depression (downward portion of CUSUM) correlated with a long-lasting excitation in the granule cell (broken line) which coincides with an increase in Purkinje cell simple spike activity (dark grey line). B plots population data comparing the Golgi cell depressions, granule cell excitations (already shown in Fig. 6D) against comparable data for Purkinje cell simple spike responses, showing the close relationship between granule cell activity and Purkinje cell simple spike responses, which were preceded by the earlier onset of Golgi cell depressions (indicated by *). Across the population, Purkinje cell responses tended to outlast those of Golgi cells and granule cells, indicated by †. Error bars represent 2 standard errors from the mean.
