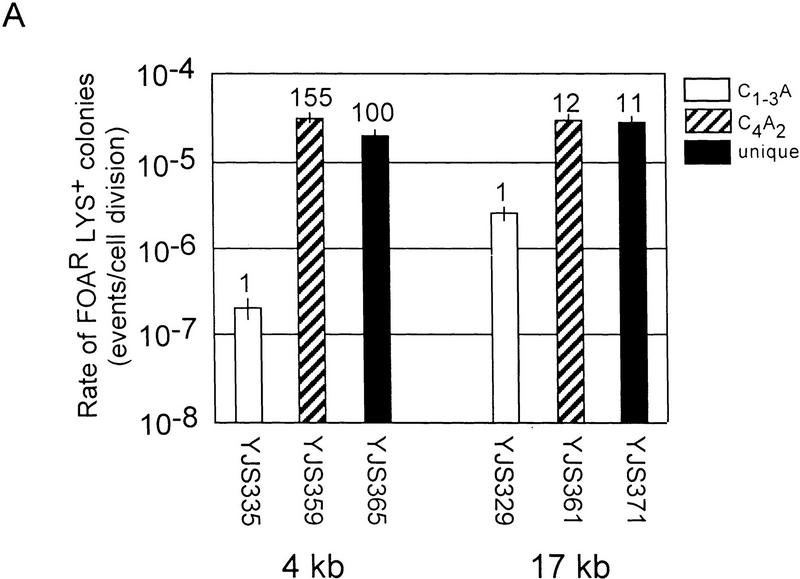
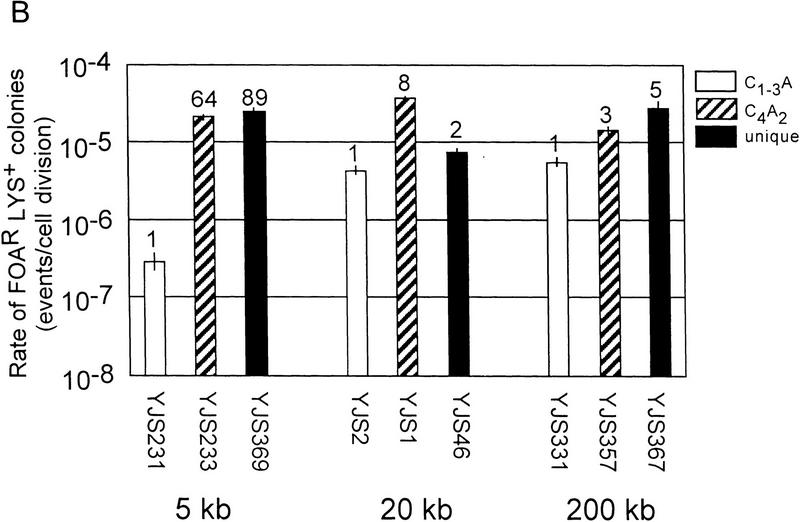
Figure 2.
Rates of recombination in a wild-type strain. (A) Rates of recombination between direct repeats at different distances from the telomere on chromosome V-R. Strain names and the distance of the repeats relative to the telomere are indicated below the bars on the x-axis. The y-axis indicates the recombination rates. The white columns are data for the C1–3A/TG1–3 substrates, the columns with diagonal lines are for C4A2/G4T2 substrates and the black columns are for the unique sequence substrate. The tops of the columns are the average median recombination rate from a minimum of four assays. The numbers above the columns represent the fold difference in recombination rate relative to the C1–3A/TG1–3 direct-repeat strain at the same location. The error bars show standard deviations (Lea and Coulson 1949). The rates for C1–3A/TG1–3 direct-repeat events are 2.0 × 10⁻⁷ (±0.6) events/cell division and 2.6 × 10⁻⁶ (±0.6) events/cell division for 4 and 17 kb from the telomere, respectively. (B) Rates of recombination between direct repeats at different distances from the telomere on chromosome VII-L. Interpretation of the graph is the same as in A. The rates for C1–3A/TG1–3 direct repeat events are 2.9 × 10⁻⁷ (±0.8) events/cell division, 4.4 × 10⁻⁶ (±0.7) events/cell division and 5.6 × 10⁻⁶ (±0.9) events/cell division for 5 and 20 kb and 200 kb from the telomere, respectively.


