Figure 5.

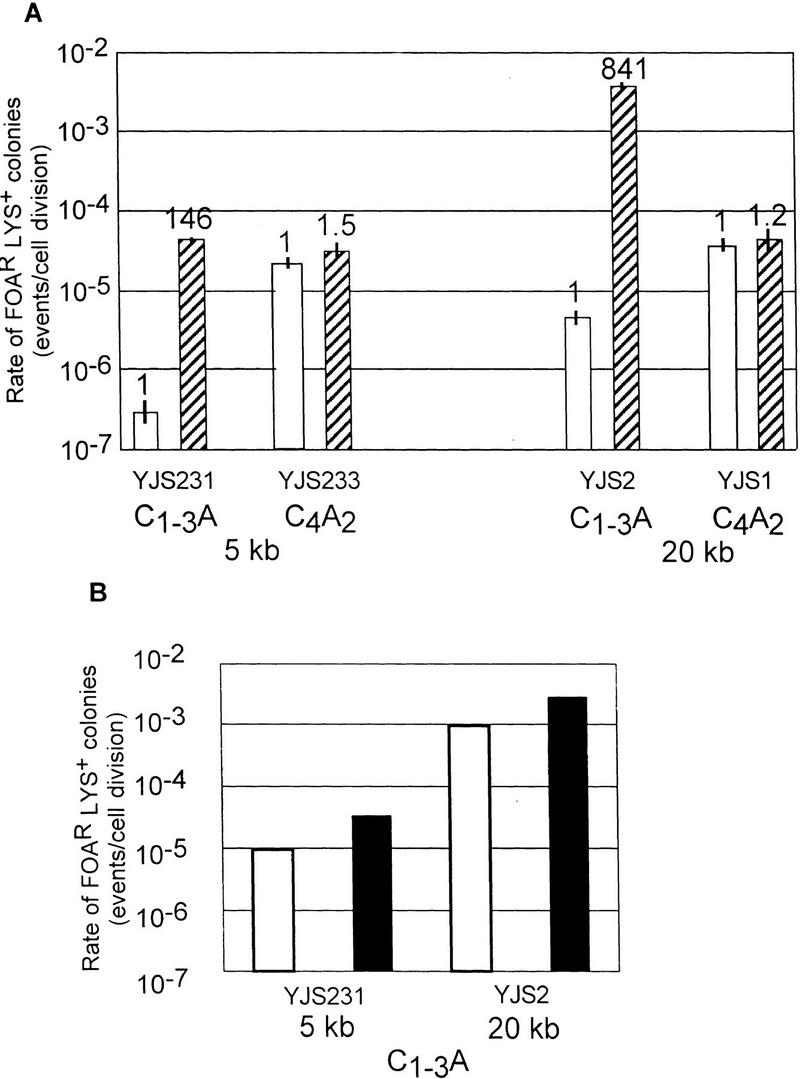
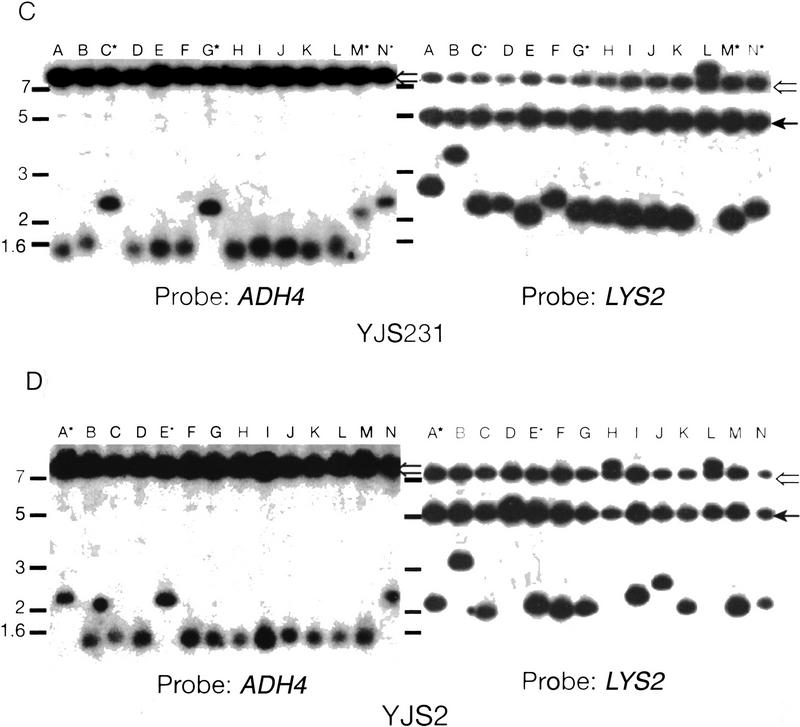
Recombination in strains overexpressing Rap1p. (A) Rates of recombination between direct repeats in strains over expressing RAP1. Description of the graph is the same as in Fig. 3. The white columns represent the values for strains with wild-type levels of Rap1p and the striped columns represent cells containing FATRAP, which express high levels of Rap1p. (B) The rates of excision or interchromosomal C1–3A/TG1–3 direct-repeat recombination events at 5 and 20 kb from the telomere are depicted separately. (Open bars) Excision events; (solid bars) interchromosomal events. The different events were determined by Southern analysis (see below). (C) Southern analysis of FOARLys+ events from YJS231 (tract 5 kb from chromosome VII-L telomere) transformed with FATRAP (see Materials and Methods). Genomic DNA was digested with BglII and run on a 1% agarose gel. Molecular mass standards (kb) are indicated at left. The probe is indicated at the bottom. The filter was first hybridized to the ADH4 (probe B), the probe was removed, and filters were then reprobed with LYS2 DNA (probe A). (Lanes A–N) Different independent recombination events. Hybridizing high molecular mass bands are caused by cross-hybridization of the probe to the FATRAP vector sequences (open arrow) and to the endogenous LYS2 gene (solid arrow). All other bands seen are products of the recombination reaction. Lanes marked with an asterisk have a 2.0–2.6 kb hybridizing band that hybridizes to both the LYS2 and ADH4 probes, indicative of an excision event. (D) Southern analysis of FOARLys+ events from YJS2 (tracts 20 kb from chromosome VII-L telomere) transformed with FATRAP. Symbols are the same as in C.

