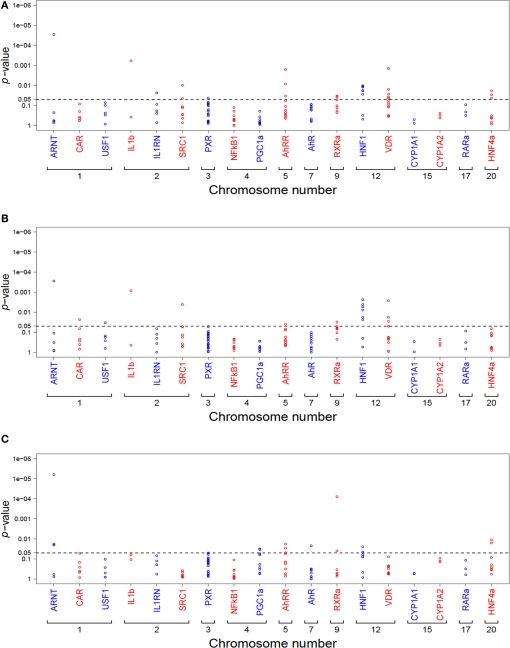
Figure 4.
Summary of univariate analysis of all tested SNPs (n = 136) in relation to CYP1A2 activity (A), protein (B), and mRNA (C). Each dot represents the minimum p-value from all four genetic models (codominant, dominant, recessive, log-additive). Genes are ordered due to chromosomal location. The dotted line marks the 5% significance level p-values are not adjusted for multiple testing.

