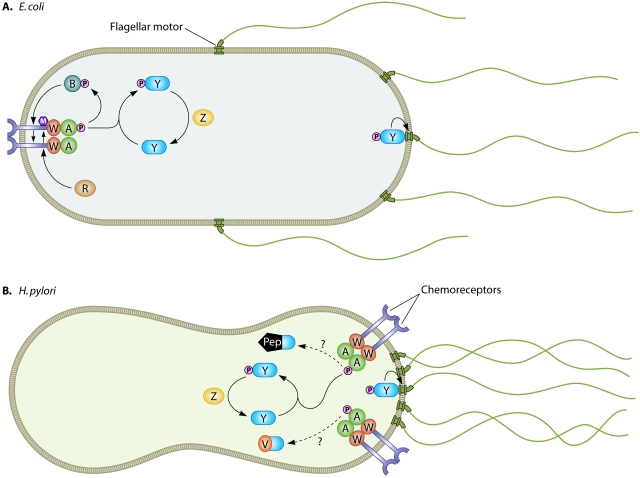
FIG 1 .
Schematic representation of chemotaxis signaling in E. coli (A) and H. pylori (B). Chemoreceptors are shown in purple and flagellar motors in green spanning the cell membrane. Cytoplasmic chemotaxis proteins CheA, CheW, CheY, CheZ, CheR, CheB, CheV, and ChePep are labeled. Protein modifications are shown as pink circles for phosphorylation and purple hexagons for methylation. Activating interactions between signaling pathway components are indicated by arrows, and speculative interactions are indicated by dotted lines.

