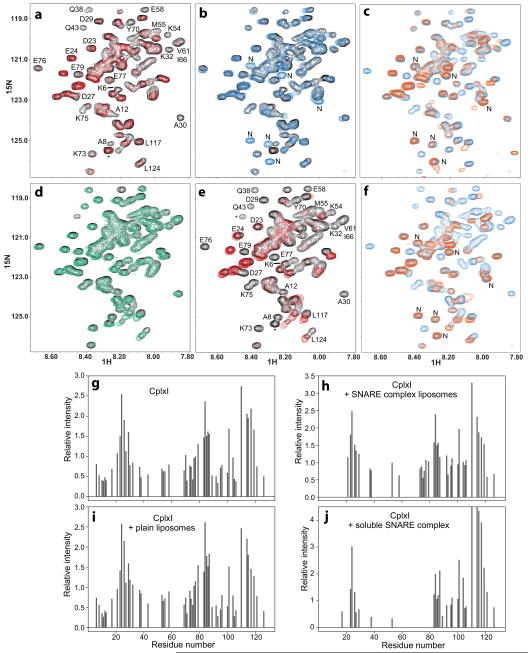
Figure 4.
The CplxI N terminus binds to the SNARE complex and the M5E K6E mutation disrupts this interaction. (a,d,e) Expansions of 1H-15N HSQC spectra of WT CplxI alone (a,d,e, black contours) or in the presence of SNARE complex-containing proteoliposomes (a, red contours), plain liposomes (d, green contours), or soluble SNARE complex (e, red contours). Selected cross-peaks are labeled. Cross-peaks from residues arising from the expression vector are indicated with asterisks. (b) Expansions of 1H-15N HSQC spectra of WT CplxI alone (black contours) and CplxI M5E K6E alone (blue contours). New peaks from CplxI M5E K6E are labeled with “N”. (c,f) Expansions of 1H-15N HSQC spectra of CplxI M5E K6E alone (c,f, blue contours) or in the presence of SNARE complex-containing proteoliposomes (c, orange contours) or soluble SNARE complex (f, orange contours). (g–j) Bar diagrams showing the relative cross-peak intensities of 1H-15N HSQC spectra of CplxI alone (g) and after adding SNARE complex-containing proteoliposomes (h), plain liposomes (i), or soluble SNARE complex (j). The corresponding spectra are shown in panels (a,d,e). The relative intensities for each spectrum are obtained by dividing absolute intensities by the average of all cross-peak intensities. Only well-resolved cross-peaks are quantified. Cross-peaks that disappeared below the noise level are assigned zero intensity. Note that, because of limited sensitivity under the conditions of our experiments, the individual cross-peak intensities exhibit substantial variability in repeated experiments, but the overall relative intensity patterns conclusively illustrate the conclusions drawn in the text.

