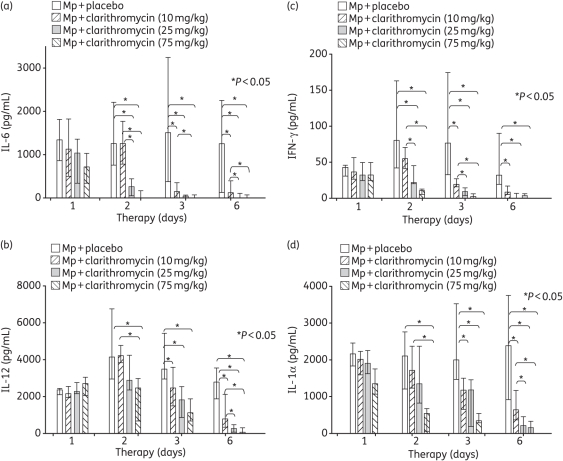
Figure 4.
Cytokine and chemokine concentrations in bronchoalveolar lavage (BAL) fluid specimens in mice inoculated with M. pneumoniae (Mp) and treated with clarithromycin at 10, 25 or 75 mg/kg/day, or with placebo for 12 days (treatment began 1 day after inoculation). (a) Interleukin (IL)-6, (b) IL-12, (c) IFN-γ and (d) IL-1α. Bars represent results from 7–12 mice per treatment group at each timepoint from repeated experiments. Values shown are the medians and 25th to 75th percentiles (error bars). *P < 0.05 between the two specified treatment groups at the timepoint by Kruskal–Wallis test followed by pairwise multiple comparisons.

