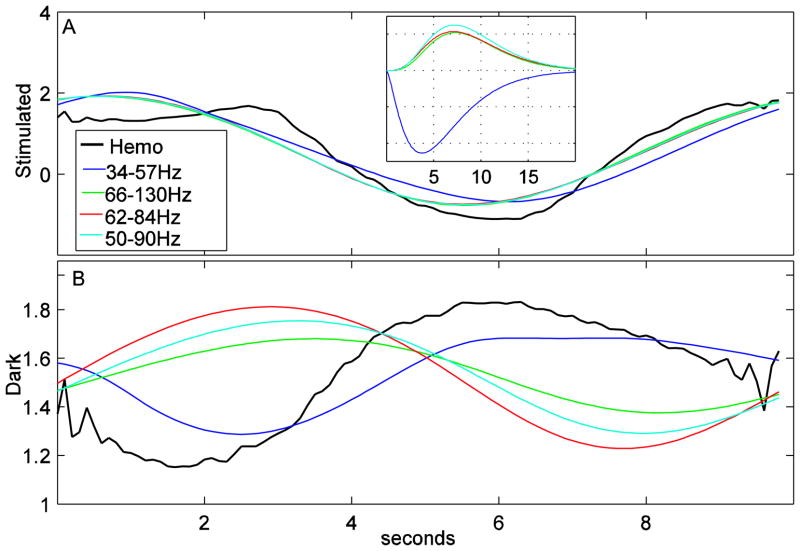
Figure 3.
The hemodynamic % signal changes (black) from Figure 2A in Sirotin and Das 2009 overlaid with the LFP data for different frequency bands convolved with a kernel. (A) The stimulated condition. The kernels are fitted for each of these frequency bands. These kernels are shown as an inset in this figure. (B) The dark condition. The kernel shapes and magnitudes from the stimulated condition were convolved with the LFP data from the dark condition to make the LFP plots.

