Table 3.
Compounds that Displayed Enhanced Inhibitory Activity Relative to Orlistat but Less Cellular Selectivitya
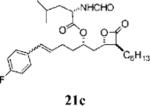
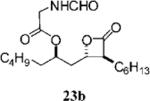
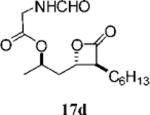
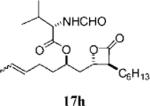
| Entry | Structure | FASTE1IC50 (μM) | MDA-MB-2312 IC50 (μM) | Hs58.Fs2 IC50 (μM) | Ratio3 | cLogP4 | Entry | Structure | FASTE1 IC50 (μM) | MDA-MB-2312 IC50 (μM) | Hs58.Fs2 IC 50 (μM) | Ratio3 | cLogP4 |
|---|---|---|---|---|---|---|---|---|---|---|---|---|---|
| 1 |

|
1.35±0.34 | 16.8±0.5 | 70.2±15.9 | 4.2 | 8.609 | 10 |
|
0.50=0.12 | 14.1 | 32.9 | 2.3 | 6.163 |
| 2 |
|
0.10 ± 0.03 | 48.0 ± 5.7 | 52.2 ± 3.9 | 1.1 | 3.140 | 11 |

|
0.50±0.18 | 54.0±9.4 | >100 | >1.9 | 2.656 |
| 3 |

|
0.12±0.29 | >100 | 43.9±13.9 | <0.4 | 8.125 | 12 |
|
0.52±0.14 | >1OO | >1OO | ND | 1.553 |
| 4 |

|
0.18±0.01 | >100 | >100 | ND | 7.901 | 13 |
|
0.68±0.12 | 56.9±19.0 | >100 | >l.8 | 4.422 |
| 5 |

|
0.20+0.04 | 26.9+12.2 | 37.3−0.3 | 1.4 | 7.901 | 14 |

|
0.79±0.12 | 88.4±7.3 | >100 | >1.1 | 4.727 |
| 6 |

|
0.29+0.04 | >100 | >100 | ND | 9.628 | 15 |

|
0.90±0.10 | 24.5±0.8 | 73.6±2.0 | 3.0 | 4.383 |
| 7 |

|
0.37±0.06 | >100 | >100 | ND | 2.508 | 16 |
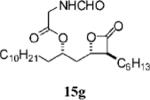
|
1.02±0.38 | 4.8=0.5 | 19.9±4.4 | 4.2 | 6.843 |
| 8 |

|
0.40±0.05 | >100 | 24.9=0.1 | <0.3 | 8.086 | 17 |

|
1.04+0.33 | 38.3+0.9 | 61.2+3.0 | 1.6 | 4.912 |
| 9 |

|
0.45±0.10 | 37.1 ±11.8 | 15.8±3.4 | 0.4 | 7.227 | 18 |

|
1.35+0.07 | 35.7+1.3 | 31.1+3.2 | 0.9 | 5.785 |
(1) Results are presented as mean and 95% CI. (2) Results are presented as the mean ± SD of at least two independent experiments. (3) Ratio of IC50 values (Hs58.Fs/MDA-MB-231). (4) cLogP values were calculated with ChemDraw Ultra 10.0 software (CambridgeSoft). ND = not determined.
