
Figure 4.
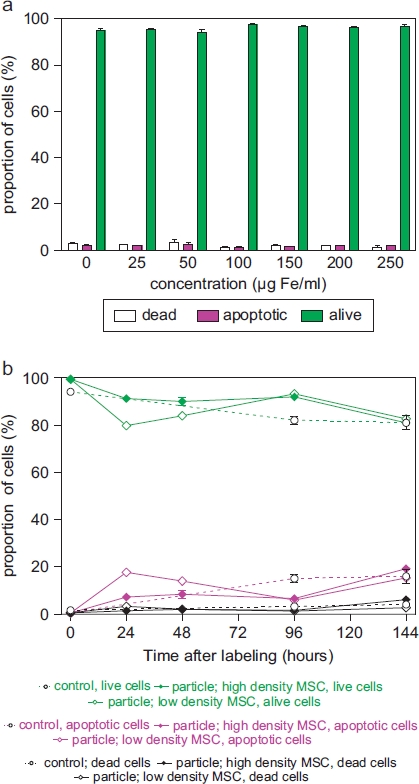
Relative proportion of living, apoptotic and dead cells as assessed by FACS measurements of 7-AAD-stained (a) MSC (passage 8), which were incubated for 24 h with MU-Wuest 3 in doses from 25 μg Fe/mL up to 250 μg Fe/mL, and (b) MSC incubated for 24 h with MU-Wuest 3 (100 μg Fe/mL) and then reseeded (5 × 10³ and 2 × 10⁴ cells/cm2) and followed-up 144 h after reseeding. Results represent mean ± standard deviation of triplicates. Dotted lines represent unlabeled control cells.