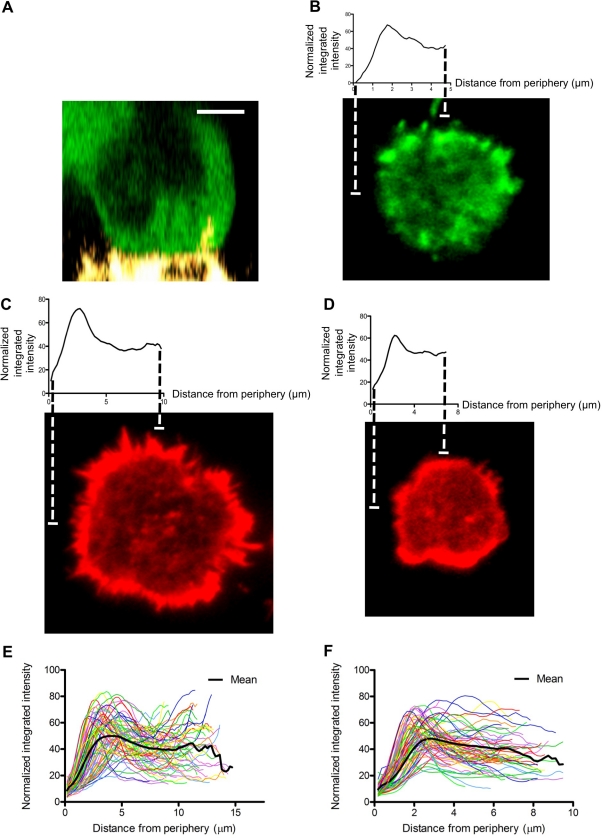
Figure 1. Actin distribution at the activated NK cell IS.
(A) 3-D projection of NK-92 GFP-actin expressing cell (green) conjugated to mel1190 target cell (yellow). Scale bar = 5 m. (B) X–Y projection of a synapse taken from a conjugate similar to (A). (C,D) X–Y projections of a representative NK-92 (left) or ex vivo (right) cell that had been activated for 30 min at 37°C on immobilized antibody to NKp30 and CD18, fixed, stained with 568 phalloidin (red), and imaged by TIRF microscopy. Above each X–Y projection is a plot of the mean fluorescent intensity (MFI) of concentric circles at a given distance beginning at the periphery of the cell and moving inward to the center (radial intensity profiles). (E,F) Plot of radial intensity profiles from 70 cells from 3 experiments for each cell type. Mean value is shown in black.

