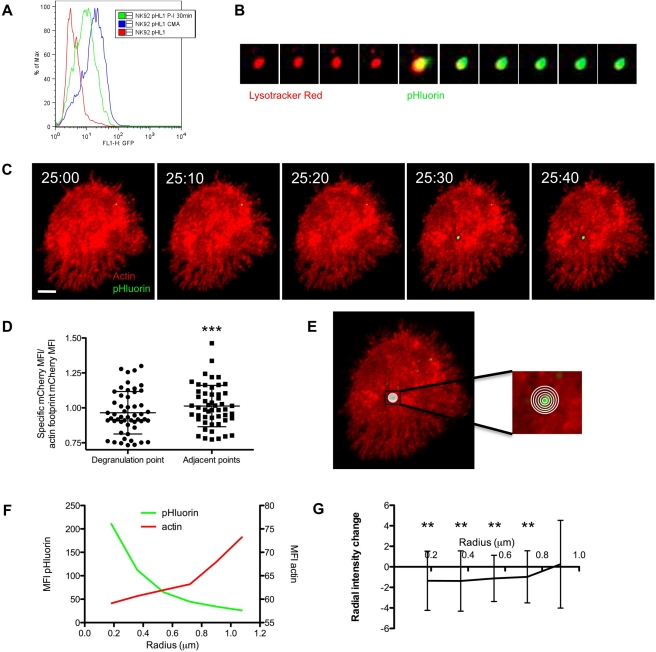
Figure 3. pHluorin-LAMP1 reports degranulation in locally hypodense regions of actin.
(A) Histogram demonstrating green fluorescence measured by flow cytometry of NK-92 cells expressing pHluorin-LAMP1. Cells were untreated or treated with PMA/Ionomycin or CMA. (B) NK-92 cells expressing pHluorin-LAMP1 (green) were loaded with LysoTracker Red (red) and imaged by TIRF under activating conditions. Frames were acquired at a rate of 2 frames per min following 10 min of activation and the image sequence depicts a cropped section showing a single lytic granule over time. (C) NK-92 cells expressing pHluorin-LAMP1 and mCherry-actin were activated by immobilized antibody to NKp30 and CD18 and imaged by TIRFm. Images shown were taken at 10-s intervals at indicated time of activation. Scale bar = 5 µm. (D) Ratio measurements of the MFI of mCherry-actin at the site of degranulation, or adjacent points, to the MFI of the whole cell footprint were calculated and represent 52 events; means = 0.965 and 1.013, respectively. (*** p = 0.0001, paired t test). (E) Image from (A) overlaid with concentric circles starting from the centroid of a degranulation event demonstrates measurement strategy for regional actin fluorescence intensity. (F) Radial intensity profiles of pHluorin and mCherry MFI are depicted and show the signal intensity changes as circles are moved radially outward from the centroid of degranulation event (left to right). (G) Radial intensity change of sequential circles moving outward from the centroid. Data represent 52 degranulation events (error bars, ± SD). Values are statistically significantly (** p<0.01, one sample t test) different to a value of 0.0, which would represent no change between sequential circles.

