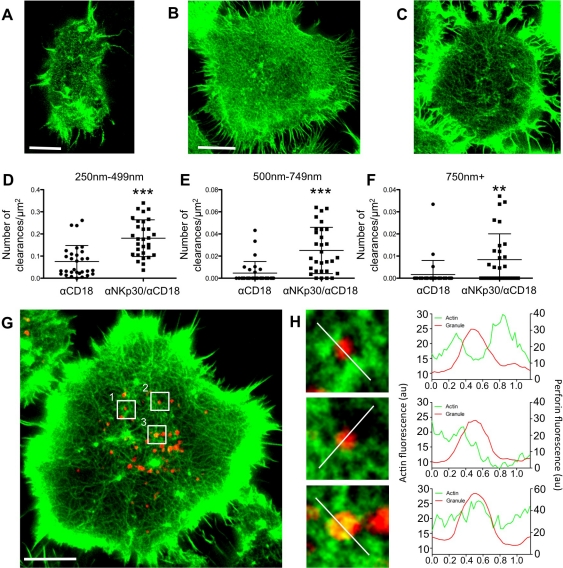
Figure 5. STED microscopy of the NK cell IS demonstrates activation-induced changes in the actin network and reveals varying granule locations relative to actin at the IS.
(A) The synapse between a Citrine-actin expressing NK-92 and mel1190 target was imaged in the X–Y plane. (B, C) NK-92 cells were stimulated for 30 min on glass coated with either antibody to CD18 (B) or to both CD18 and NKp30 (C) and stained for F-actin with phalloidin. (D–F) Measurements of the number of clearances at the synapses of 30 cells from 2 experiments activated as in (B,C). (*** p<0.001; ** p = 0.0076; unpaired t test). Measurements were grouped into clearance diameters of 250–499 nm (D), 500–750 nm (E), and 750+ nm (F). (G) Activated NK-92 cell stained for F-actin (green) and perforin (red) and imaged via STED microscopy in the green channel and confocal microscopy in the red channel. (H) Magnified images are from boxes in (G): box 1 (top), box 2 (middle), and box 3 (bottom). To the right of each image is a line profile indicating pixel intensities of actin (green) and perforin (red) for the line bisecting the granules as indicated by the white line. Scale bars = 5 µm.

