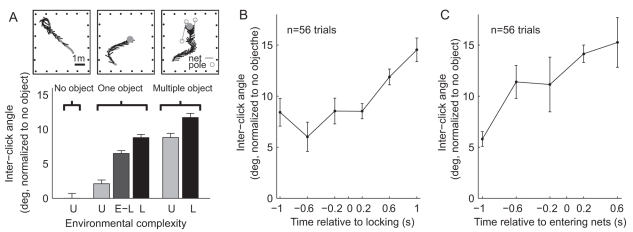
Figure 2. The inter-click angle increases with the increase in environmental complexity.
(A) Top, schematic of the three experimental setups. Bottom, inter-click angle in the different experimental conditions. U, unlocked; L, locked; E-L, instances of early-locking prior to the final locking. Note increase in inter-click angle with environmental complexity. (B–C) Increase in inter-click angle along the approach, during multiple-object experiments. (B) In these experiments, the inter-click angle along the approach had a higher value (higher than in the one-object setup) and exhibited a gradual increase after the final locking onto the landing target. (C) When using the bat's entrance between the nets as an alternative locking criterion, it became evident that most of the increase in inter-click angle has occurred between 1 and 0.5 s before the bats entered in-between the nets. Note different x-axis in (B) and (C). Error bars, mean ± s.e.m.

