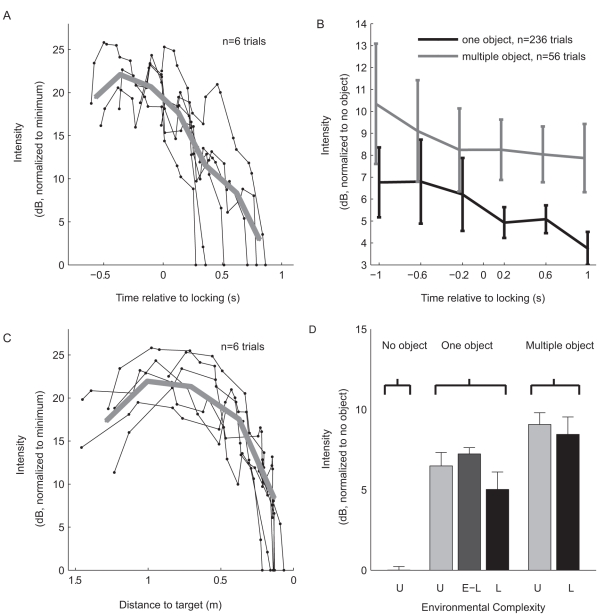
Figure 3. Lingual echolocators modify the intensity of their emissions according to the environmental complexity and the stage of target approach.
(A) Examples of six trials, showing that emission intensity gradually decreases with time along the approach. Average is depicted by thick gray line. (B) Population average intensity plotted as function of time relative to locking, for the one-object and multiple-object setups. Error bars, mean ± s.e.m. The two curves were shifted by 30 ms relative to each other, for display purposes only. (C) Examples of the same six trials as in (A), with intensity plotted as function of distance to target. Average is depicted by thick gray line. Note decrease in intensity that began 80–100 cm before landing. (D) Click intensity increased with the environmental complexity. Intensity was not lower when the bats were locked on the target before the final locking (dark gray bar marked E-L).

