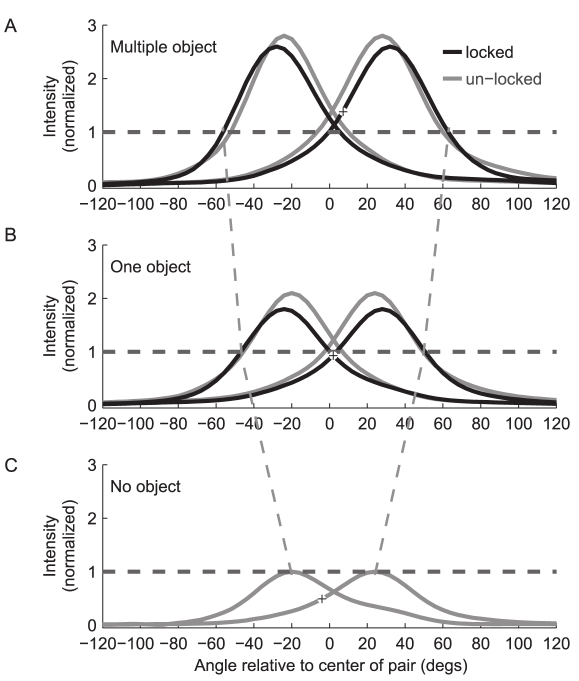
Figure 4. Combined effect of the changes in click intensity and changes in inter-click angle, across the different experimental setups.
(A) Multiple-object experiment. (B) One-object experiment. (C) No-object experiment. Dashed gray lines depict the effective increase in field-of-view due to the combined increases in inter-click angle and click intensity; here we assumed a constant hearing threshold at normalized intensity of 1. Horizontal dashed lines, normalized intensity = 1; note that in all panels, this intensity was kept constant by the bats around their region of interest (see text). In all panels, “+” symbols depict the point of maximum-slope of the right beam (the locked beam when there are two): Note how the maximum slope changes position from being lateral (right) to the target in the multiple-object experiments, to pointing straight at the target in the one-object experiments, to being medial (left) to the target in the no-object experiments.

