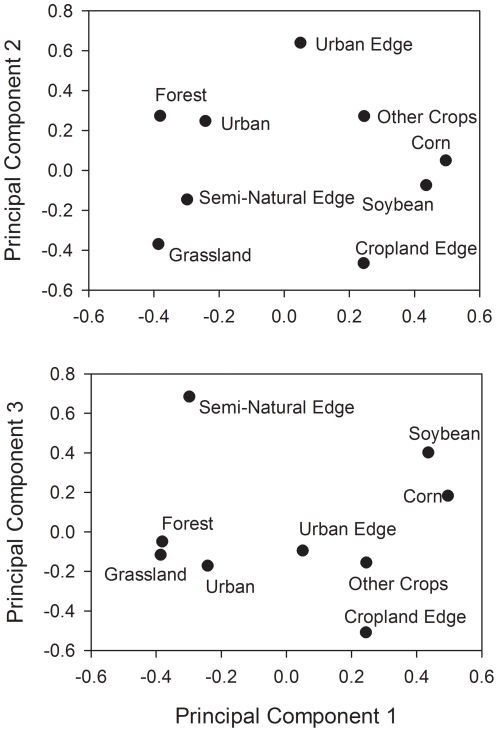
Figure 2. PCA ordination for principal components (PC) 1–3 landscape variables sampled at a radius of 2 km and edge variables bordering soybean fields.
Points indicate the principal component loadings of each variable included in the PCA analysis. Sites with positive loadings on PC1 were correlated with the variables Corn and Soybean while negatives loadings on PC1 were correlated with the variables Forest and Grassland. Sites with positive loadings on PC2 were correlated with the variable Urban Edge while negative loadings on PC2 were correlated with the variables Cropland Edge. Sites with positive loadings on PC3 were correlated with the variable Semi-Natural Edge while negative loadings on PC3 were correlated with the variable Cropland Edge.

