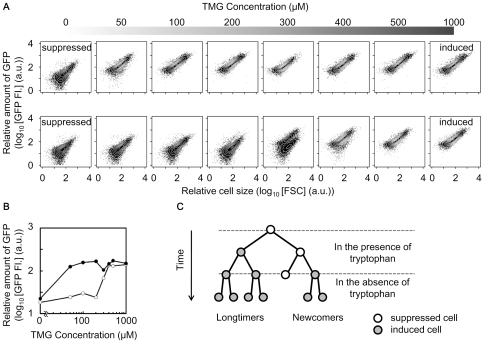
Figure 2. Hysteresis and bistability of the induced and suppressed states.
A. Scatter plots merged with contours of cell population with various concentrations of TMG. The top grey bar represents the concentration of TMG as greyscale and each plot indicates the cell population exposed to the corresponding TMG concentrations 18 h after inoculation. The upper and lower panels indicate the cell populations preliminarily cultured in the presence (induced state) and absence (suppressed state) of TMG, respectively. The induction was carried out with 1,000 µM TMG. B. Hysteresis in the expression of GFP (TrpC). The relative concentrations of GFP (TrpC) were calculated as the mean values of the cell populations indicated in A. The black and grey trajectories represent the cell populations of the suppressed (upper panels in A) and induced (bottom panels in A) memories, respectively. C. Schematic diagram of cellular lineage before and after tryptophan depletion. The induced cells (grey circles) grew even when tryptophan was depleted, while the suppressed cells (open circles) did not proliferate unless the stochastic switching event occurred. Colour change in the cellular lineage diagram corresponds to the change in expressional change for a particular cell.

