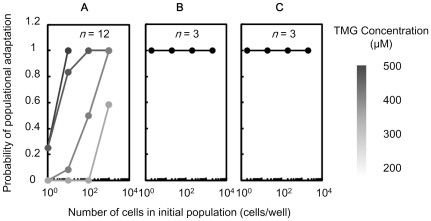
Figure 5. Persistence of population adaptation against reduced population size.
Probability of adaptation of the cell population, ratio of wells with cell proliferation to total wells, is plotted over the number of cells in the initial population (population size) after collection through cell sorting. A. Probability of population adaptation for suppressed cells exposed to different TMG concentrations (from 200 to 500 µM) in the absence of tryptophan. The TMG concentration is shown in greyscale. B. Probability of population adaptation for induced cells, exposed to 200 µM TMG but with a history of 1,000 µM TMG in advance (Figure 2, upper panel), in the absence of tryptophan with the same TMG concentration. (c) Probability of populational adaptation for suppressed cells, exposed to 200 µM TMG, in the presence of tryptophan with the same TMG concentration.

