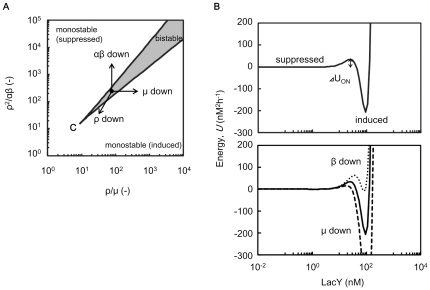
Figure 6. Parametric phase plane and energy landscape.
A. Parametric phase plane of lactose utilisation network. Boundaries between monostable and bistable (grey) regime was calculated by the general positive feedback model (Materials and Methods). The critical point is indicated by C. Parameters µ and α are the cell growth rate and the maximal synthesis rate of LacY, which is achieved when every LacI repressor is inactivated, respectively. The other two parameters, β and ρ, are proportional to TMG uptake rate per LacY and synthesis rate of LacI, respectively (Materials and Methods). B. Example of energy landscape respective to LacY in the bistable regime. The energy landscape was calculated by integration of the differential equation of LacY with regard to LacY (solid lines, Materials and Methods). The energy barrier from the suppressed to the induced state is indicated by ΔUON. The energy landscapes with reduced β and µ are also indicated in the bottom panel (dotted and dashed lines, respectively). The parameters are as follows: α, 60 nM h−1; ρ, 50 h−1; β, 0.1 (solid and dashed lines) or 0.09 (dotted lines) µM−1h−1; µ, 0.5 (solid and dotted lines) or 0.45 h−1 (dashed lines).

