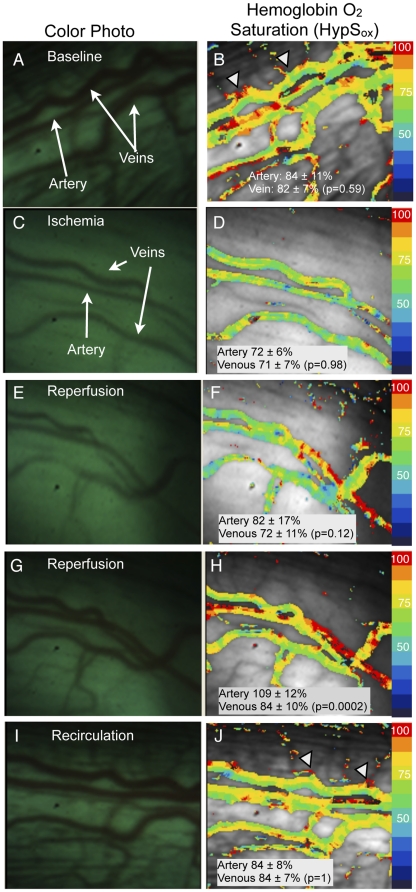
Figure 4. Changes in HypSox gradients during ischemia and subsequent reperfusion of retinal vessels.
Color fundus images of retinal vessels (panels A,C,E,G,I) with corresponding pseudocolored HypSox measurements (panels B,D,F,H,J). (B) HypSox measurements at baseline and subsequently (D) after elevating intraocular pressure (IOP) to induce ischemia. Note significant desaturation of arterial and venous HypSox post-ischemia (Artery: 84±11% versus 72±6%, p = 0.017; Venous: 82±7% versus 72±7, p = 0.00006; paired, two-tailed Student T-test, n = 10). The third row (E,F) and fourth row (G,H) panels correspond to images acquired in succession during reperfusion. Arterial saturation values increase from 72±6% (panel D) to 109±12% (panel H) as the artery is reperfused (n = 10, p = 0.00001, paired, two-tailed Student T-test). The last row (panel I,J) illustrates HypSox measurements after 15 minutes of reperfusion (i.e. recirculation). Notice the prominent intravascular oxygen gradients when comparing panel 4B (ischemia) and panel 4J (recirculation). Images may not show exactly the same field-of-view and each image may vary slightly in orientation due to ocular movements.

