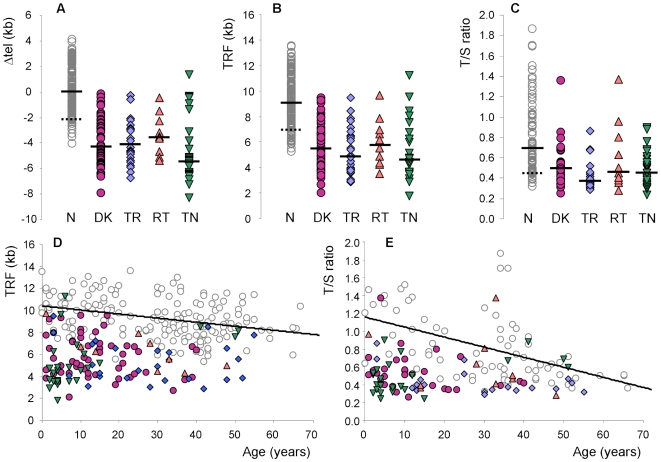
Figure 3. Telomere length measurements in patients with telomerase and shelterin mutations.
Different genetic subgroups of patients with telomerase and shelterin mutations, shown as purple circles (DKC1 mutations), blue diamonds (TERC mutations), pink triangles (TERT mutations) and inverted green triangles (TINF2 mutations) are compared to healthy controls (open grey circles). Solid bars indicate median values and the dotted bars indicate the 10th centiles of the healthy control measurements. (A) Telomere lengths were measured by Southern blot analysis and adjusted for age to give a Δtel value (54). N = normal healthy controls (n = 176), DK = patients with DKC1 mutations (n = 56), TR = patients with TERC mutations (n = 26), RT = patients with TERT mutations (n = 10), TN = patients with TINF2 mutations (n = 26). (B) Absolute telomere lengths, measured as terminal restriction fragments for the same group of patients as shown in panel A. (C) Telomere lengths measured as a T/S ratio, determined by monochrome multiplex quantitative PCR for a subset of patients shown in panel A (73 healthy controls and 29, 19, 10 and 23 patients with DKC1, TERC, TERT and TINF2 mutations, respectively). (D) Absolute telomere lengths (terminal restriction fragments) plotted against age in years, for the patients and health controls shown in panel A. A line of best fit is drawn for the healthy controls. (E) Telomere lengths measured by monochrome multiplex quantitative PCR analysis plotted against age in years for all patients in panel C. A line of best fit is drawn for the healthy controls.

