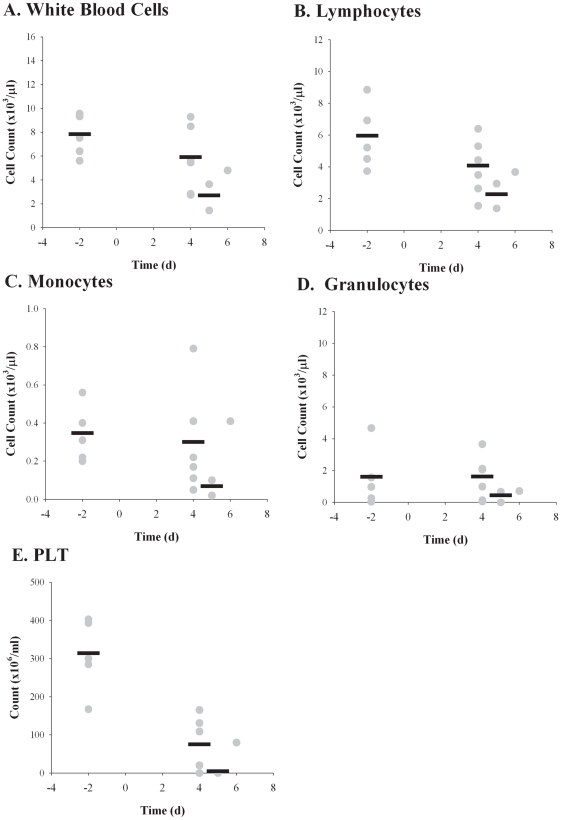
Figure 3. Lymphopenia after inhalation of F. tularensis.
Blood samples collected pre- and post-exposure were analyzed for changes in WBC (A), lymphocytes (B), monocytes (C), granulocytes (D), and platelets (E). Graphs show counts for individual rabbits (gray circles) and averaged data (black bars) for each time point after exposure when blood was drawn (days −2, 2, 4, 6, and at euthanasia).

