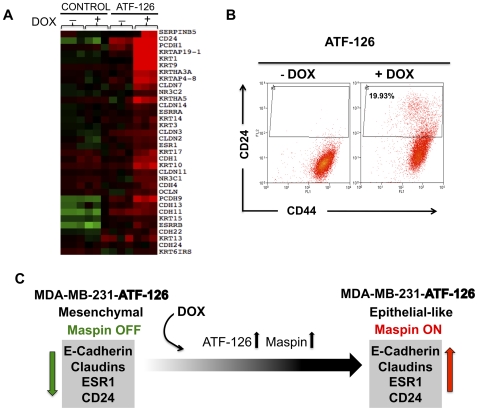
Figure 7. ATF-126 regulates markers associated with decreased tumorigenicity and metastasis.
A. Microarray expression analysis of selected epithelial markers in CONTROL and ATF-126 cells, in presence or absence of DOX. Cells were collected 72 hours after DOX induction. Arrays were performed in triplicate with three different biological replicates using Agilent 44 k arrays. The Array tree was derived from an unsupervised hierarchical clustering and the gene list is shown in Table S1. Each colored square on the upper right represents the relative mean transcript abundance (in log2 space) with highest expression being red, average expression being black, and lowest expression being green. B. Induction of ATF-126 by DOX modifies the tumor initiating cell signature CD44+CD24−. Representative flow cytometric analysis of CD44 and CD24 expression levels in ATF-126 −DOX and +DOX cells collected 72 hours after treatment. The forward scatter (FCS) channel was plotted in y-axis and the fluorescence of the cell surface antigens in the x-axis. The gate in the +DOX panel illustrates the generation of a novel CD24+ population upon induction of ATF-126. C. A model illustrating a potential mechanism by which ATF-126 could reprogram a mesenchymal, Claudin-low MDA-MB-231 cell line towards a more epithelial-like phenotype.

