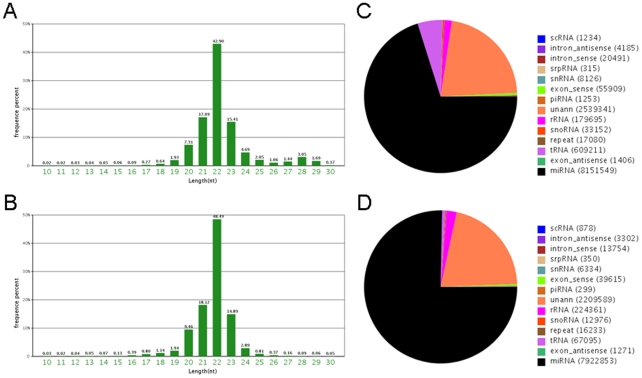
Figure 2. Size and frequency distribution of the sequencing reads, and calssification of small RNAs.
A. Length distribution of the non-redundant sequencing reads from normal DRG. B. Length distribution of the non-redundant sequencing reads from normal SN. C. Classification of the sequenced small RNA tags from normal DRG. D. Classification of the sequenced small RNA tags from normal SN.

