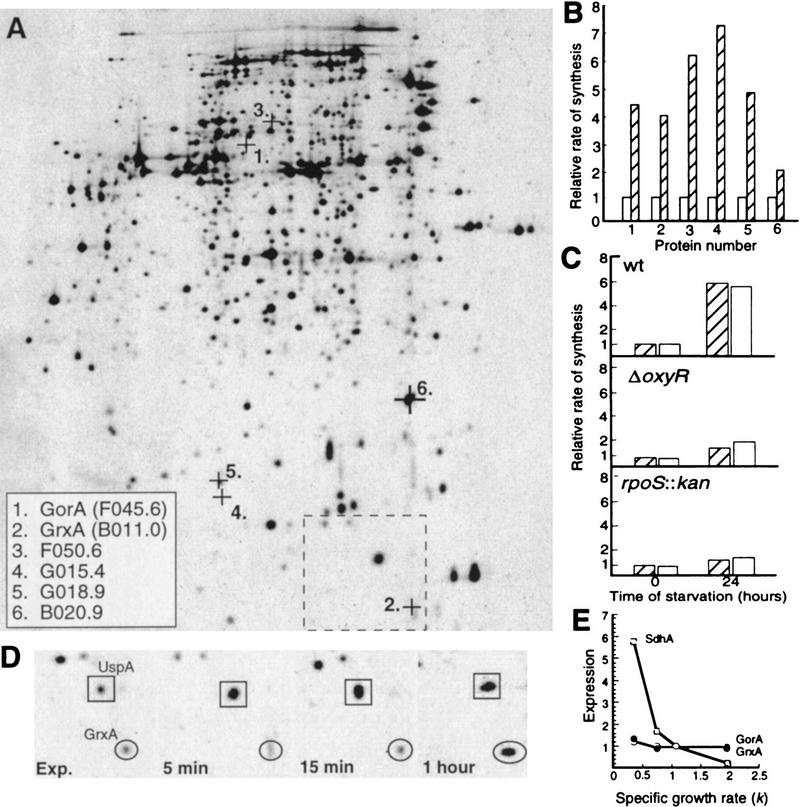
Figure 1.

Synthesis of oxidative-defense proteins during starvation. (A) Location on the two-dimensional reference gel of the OxyR-dependent oxidative-stress proteins identified as inducible by carbon starvation. The alpha-numeric designations and protein names of identified proteins are shown in the inset box. The box with broken lines denotes the area shown in D. (B) Relative rate of synthesis of oxidative-stress proteins during growth (OD = 0.4 ± 0.05) (open bars) and after 16 hr carbon starvation (hatched bars). The rate of synthesis during exponential growth was assigned a value of 1.0. (C) Relative rate of GorA (hatched bars) and GrxA (open bars) synthesis during growth and starvation in wild-type, ΔoxyR, and rpoS::kan backgrounds. The rate of synthesis of GorA and GrxA during exponential growth in the wild-type background was assigned a value of 1.0. (D) Kinetics of GrxA synthesis in comparison to UspA during carbon starvation. (E) Relative rates of synthesis of GorA (•) and GrxA (○) in comparison to SdhA (□) at varying growth rates. The cultures were grown exponentially in minimal MOPS media supplemented with acetate, glycerol, or glucose as carbon sources and glucose plus amino acids, nucleotides, and vitamins for rich medium. The rates of protein synthesis are plotted relative to the rate of synthesis in glucose minimal media which was assigned a value of 1.0. Growth rates in the different media are expressed as k, the first-order growth-rate constant. The analysis was repeated three times to confirm reproducibility. Representative results are presented in the figure and the standard deviation was always <10% in the measurements of rates of individual protein synthesis.
