Figure 6.

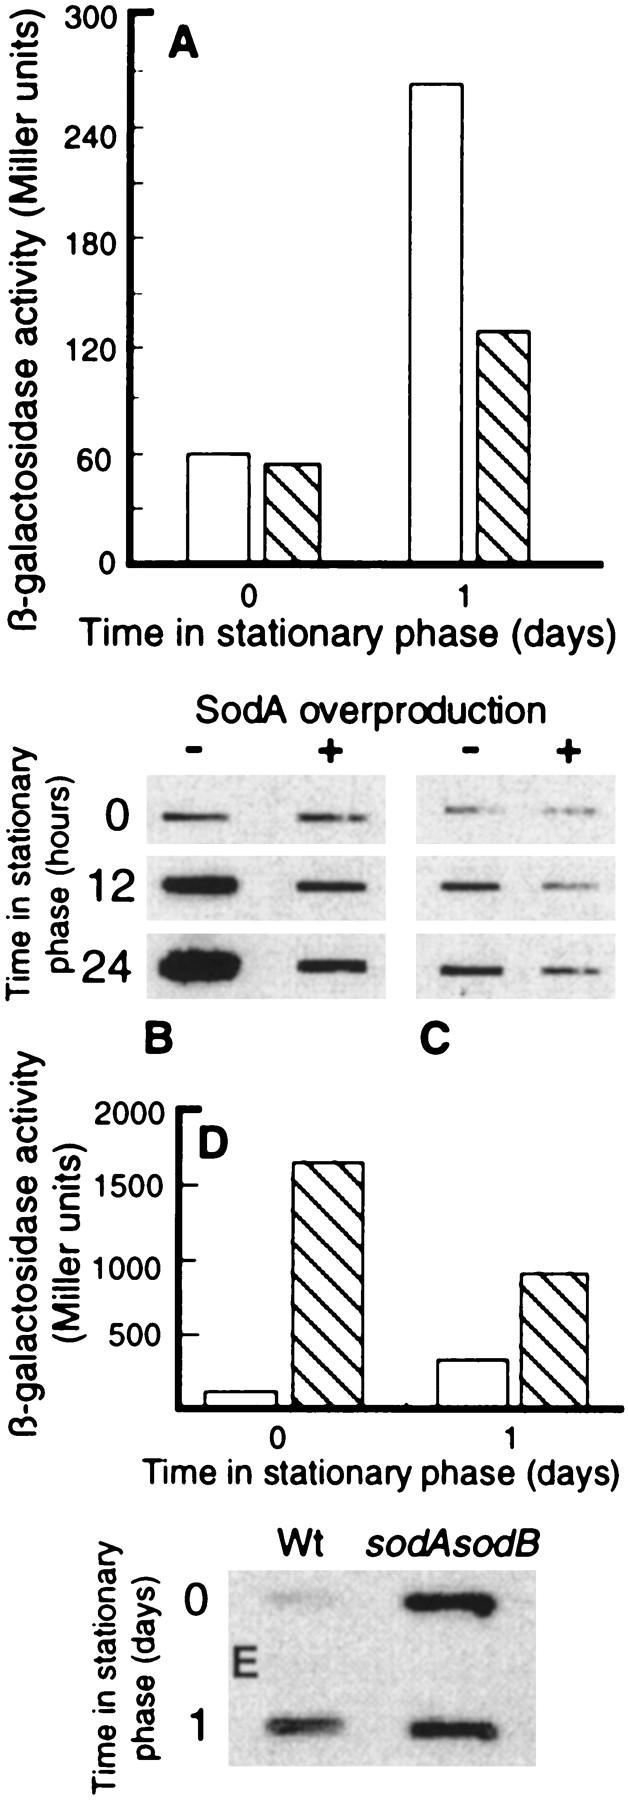
Effects of overproducing SodA on stasis-induced heat shock gene expression. (A) groEL promoter activity in the absence (open bars) and presence (hatched bars) of elevated SodA levels during growth (time zero, OD = 0.3 ± 0.05) and in stationary phase (day 1). Expression of GroEL was determined by measuring β-galactosidase activity in cells harboring a chromosomal groEL–lacZ fusion. (B) Levels of DnaK during growth (time zero) and at times in stationary phase in the absence or presence of elevated levels of SodA. The levels of DnaK was determined by Western blot analysis using monoclonal mouse anti-DnaK antibodies. (C) Protein carbonyl levels during growth (time zero) and at times in stationary phase in the absence or presence of elevated levels of SodA. Equal amounts of protein were loaded in each slot. (D) groEL promoter activity in the wild-type strain (open bars) and a sodA sodB double mutant (hatched bars) during growth (time zero, OD = 0.3 ± 0.05) and stationary phase (1 day). (E) Levels of DnaK during growth (time zero) and after 1 day of stationary phase in wild-type and sodA sodB double mutant strains. The levels of DnaK was determined by Western blot analysis using monoclonal mouse anti-DnaK antibodies. The analysis was repeated three times (Miller units) or two times (Western blot) to confirm reproducibility. Representative results are presented in the figure and the standard deviation was always <10%.
