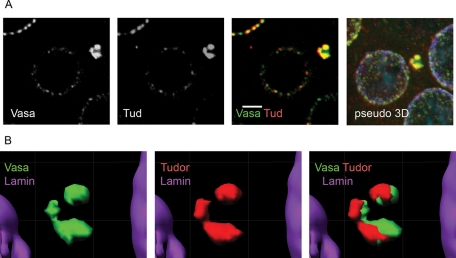
FIGURE 4:
Partial colocalization of Vasa and Tud in the piNG-body. (A) The piNG-body stained with anti-Vasa (green) and anti-Tud (red) antibodies, as well as the corresponding pseudo-3D image, are shown. Testes of yw flies were stained with anti-Vasa (green), anti-Tud (red), and anti-lamin (violet) antibodies; chromatin was stained with DAPI (blue). Colocalization of green and red signals yields yellow color. Scale bars, 3 μm. (B) An isosurface image for the piNG-body presented in A. In spite of the observed significant colocalization of Vasa and Tud signals, nonoverlapping zones are clearly seen.

