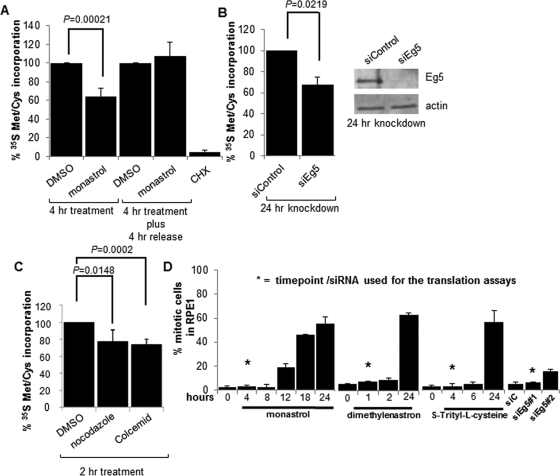
FIGURE 1:
Eg5 inhibition or microtubule disruption causes a defect in protein synthesis. Quantitation of 35S Met/Cys incorporation assays in WCLs from RPE1 cells as indicated (A) 4 h after a 130 μM monastrol or DMSO (solvent control) treatment or a 4-h monastrol or DMSO treatment followed by a 4-h release into the same medium without monastrol or DMSO, (B) 24 h before or after Eg5 knockdown (siEg5#1), or (C) a 2-h treatment with 12 μM nocodazole or 0.002 mg/ml Colcemid (microtubule disruptors) or the DMSO solvent control. CHX treatment in A was used as a positive control. In B, a representative immunoblot is shown to demonstrate Eg5 was knocked down 24 h after the addition of siEg5#1 siRNA; actin is used as the loading control. Results are shown as means ± SD and are representative of at least three independent experiments; p values are derived from Student's t test (null hypothesis). (D) Quantification of mitotic indices by DAPI staining after a 130 μM monastrol treatment, 3 μM dimethylenastron, or 1.5 μM S-trityl-l-cysteine for the indicated times or Eg5 knockdown by siEg5#1 or siEg5#2 siRNA for 24 h. DMSO was used as the control for the small-molecule inhibitor treatments, and siControl was used as the control for the knockdown experiments. Asterisks represent the time point or the siRNA at which all translation experiments were completed (except where indicated). There is no significant increase in mitotic indices between the time points labeled with asterisks and controls (0 h or siControl; p > 0.1). Longer treatments of Eg5 inhibition are shown and did lead to a mitotic arrest, but these times were not used in the translation experiments; instead, they are shown to demonstrate that the Eg5 inhibitors were active at the concentration used. In each experiment, a minimum of 300 cells were counted and at least three independent experiments were completed. Results are shown as means ± SD.

