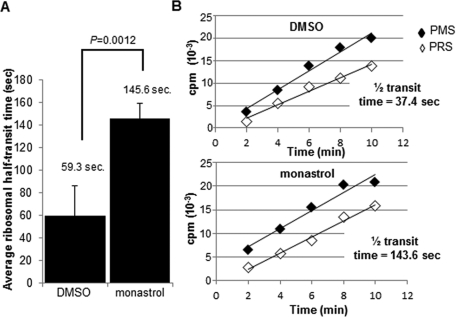
FIGURE 5:
Inhibition of Eg5 slows the rate of ribosome transit. Ribosome half-transit assays before (DMSO) or after (4 h, 130 μM monastrol) Eg5 inhibition in RPE1 cells, as described further in Materials and Methods and Results. Briefly, incorporation of 35S Met/Cys into total proteins (postmitochondrial supernatants [PMS]; black diamonds) and completed proteins (postribosomal supernatants [PRS]; white diamonds) were graphed over time. The half-transit time was determined by linear regression analysis from the displacement in time between the two x-intercepts. (A) Bar graph represents the average half-transit time of four independent experiments before (DMSO) or after (monastrol) Eg5 inhibition and demonstrated an ∼2.5-fold increase after Eg5 inhibition. (B) A single representative experiment is shown with the calculated half-transit times for this experiment. The DMSO half-transit time was calculated to be 37.4 s (transit time, 1 min, 15 s), whereas after a 4-h monastrol treatment the half-transit time was 143.6 s (transit time, 4 min, 47 s), resulting in an ∼3.8-fold increase for this representative experiment. Results in A are represented as means ± SD; p values are derived from Student's t test (null hypothesis).

