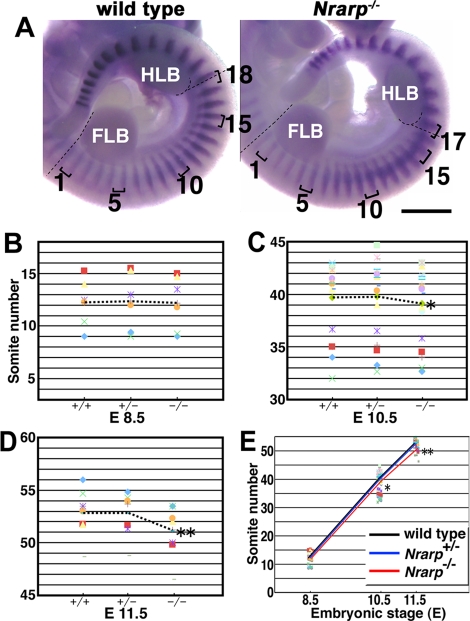
FIGURE 2:
Nrarp-null mice have smaller numbers of somites. (A) Comparison of the numbers of somites between the FLB and the HLB. The dashed lines are used to indicate the rostral borders of the FLB and the HLB. Uncx4.1 expression was detected in the posterior half of each somite. The brackets are used to indicate single somites. Scale bar, 1 mm. (B–E) The average number of somites for each indicated genotype was plotted, and the same symbol was used to indicate the littermate. The averages of the total numbers of somites within littermates were compared using the paired t test. The dashed lines are used to indicate the average number of somites for each genotype at each stage (mean ± SEM). (B) At E 8.5, no significant difference was detected between the wild type (12.24 ± 0.93) and the Nrarp+/− (12.36 ± 1.14) or Nrarp−/– (12.20 ± 1.08) embryos (n = 6 pregnant females). (C) At E 10.5, the number of somites in the Nrarp−/– embryos (39.16 ± 0.84) was significantly lower than in the wild-type embryos (39.69 ± 0.83) (n = 18; *p < 0.02). The average of the difference was 0.5. (D) At E 11.5, the number of somites in Nrarp−/– embryos (51.11 ± 0.95) was significantly lower than in the wild-type embryos (52.85 ± 0.78) (n = 8; **p < 0.01). The average of the difference was 1.7. (E) The average number of somites of the wild-type embryos (black) and of the Nrarp+/− embryos (blue) and the Nrarp−/– embryos (red) were compared at three different stages. There were no significant differences between the wild-type embryos and the Nrarp+/− embryos at any stage.

