
Figure 6.
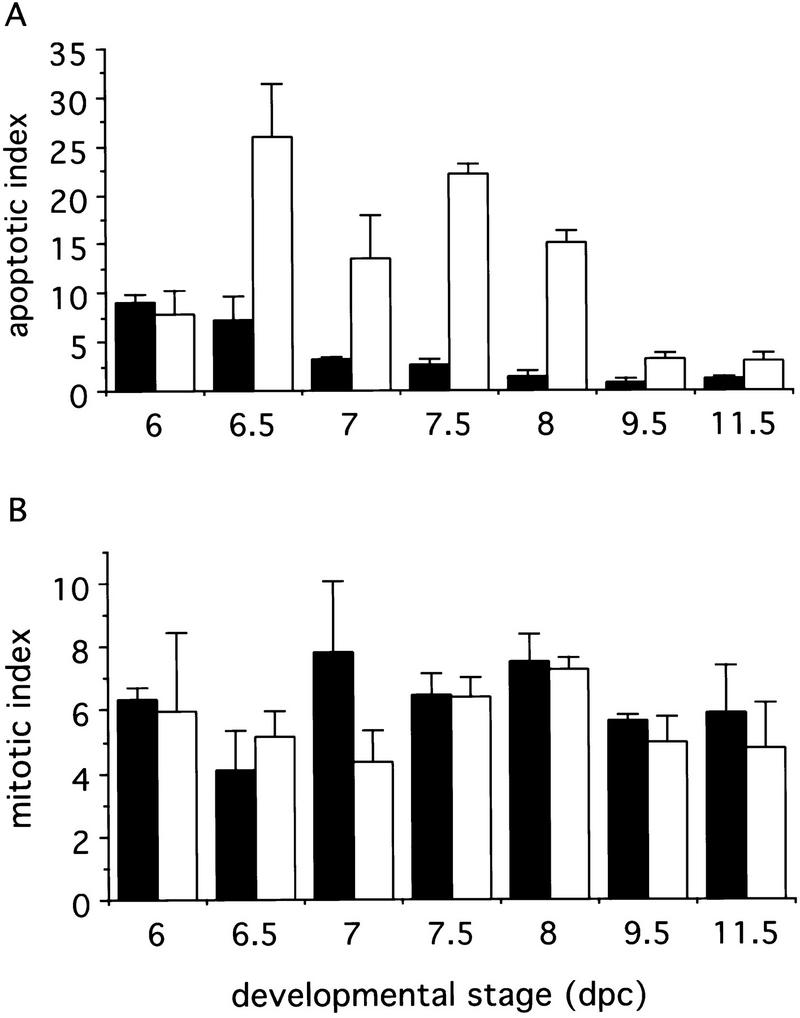
Analysis of apoptosis and mitosis in Blm mutant embryos. For 6.0-, 6.5-, 7.0-, 7.5-, and 8.0-dpc embryos, Feulgen-positive pyknotic nuclei, or mitotic figures, divided by the total number of cells scored in the epiblast, yield the apoptotic (A) or mitotic (B) index, respectively. For 9.5- and 11.5-dpc embryos, neuroectoderm was scored. For each embryo, two adjacent 5 μm sections were counted and the average value obtained. Equal numbers of normal and mutant embryos were evaluated at each developmental stage, for 6.0, 6.5, 7.5, 8.0, 9.5, 11.5 dpc (N = 6) and 7.0 dpc (N = 8). Bars, average values for normal or mutant embryos (solid bars and open bars, respectively). Error bars, average deviations from the mean.