
Figure 7.
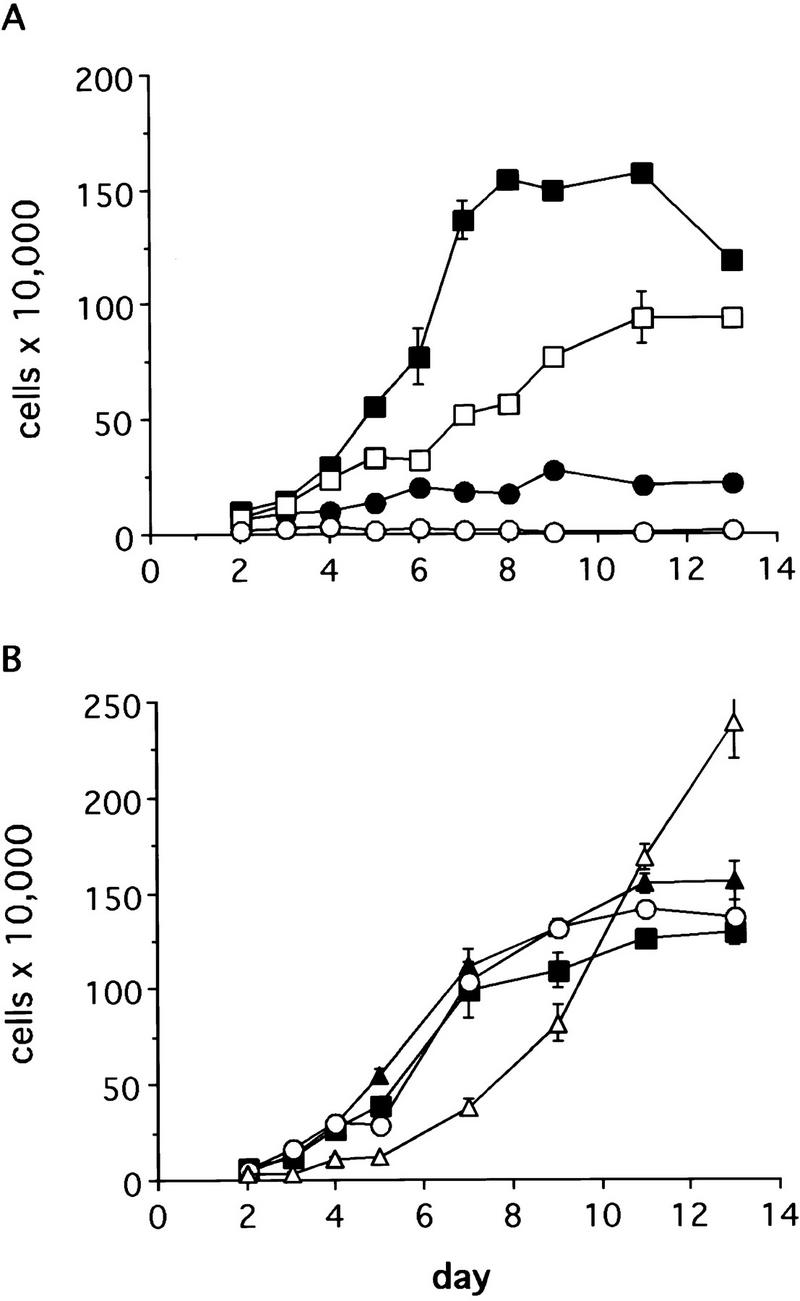
Retarded growth of primary Blm−/− embryonic fibroblasts. The proliferation rates of low passage mutant cultures in A are compared with those of later passage postcrisis lines in B. (A) Growth curve on passage 3 embryonic fibroblasts consisting of a pair of cultures derived from 13.5-dpc Blm+/+ (█) and Blm−/− (•) Blm embryos and a pair of cultures derived from 12.5-dpc Blm+/− (□) and Blm−/− (○) embryos. Each time point is represented by the average of cell counts from duplicate wells; error bars represent the range between values. (B) Growth curve on postcrisis cell lines that varied in passage number from 9 to 11, consisting of wild-type, heterozygous, and two mutant clones, generated as described in Materials and Methods. Clone designations: (█) 6562-1 Blm+/−; (▴) 6562-6 Blm+/+; (○) 8019-1 Blm−/−; (▵) 8301-2 Blm−/−. Growth rates are evaluated in similar fashion to cultures in A. The cell lines in B are derived independently of the cultures shown in A.