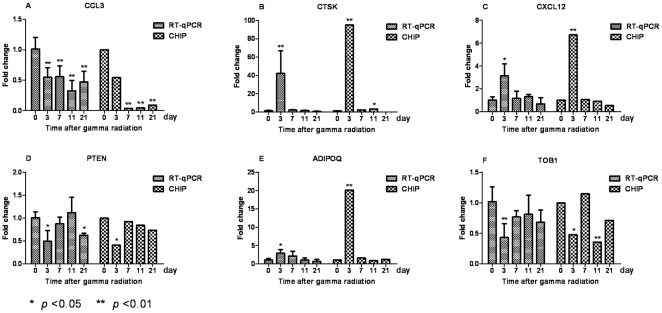
Figure 6. Validation of microarray results in BM after IR.
A∼F show the expression fold changes of six differentially expressed genes: Ccl3, Ctsk, Cxcl12, Pten, Adipoq and Tob1 at 3, 7, 11 and 21 DAI compared with sham-irradiated (0 DAI) samples (error bar represents one s.d.). The relative changes in gene expression were calculated by the 2−ΔΔCt method, with Gapdh serving as an internal control gene.

