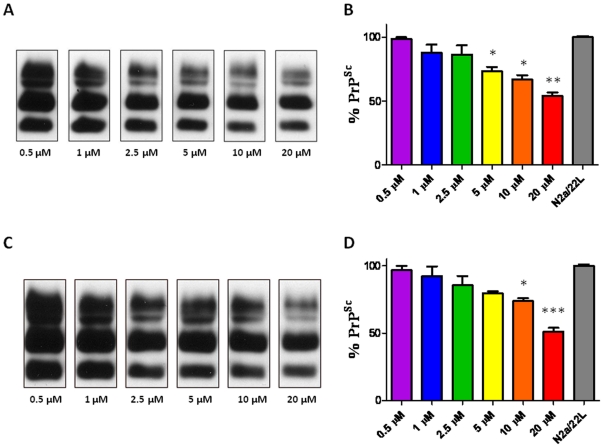
Figure 1. Anti-Prion Activity of Styryl-based Compounds 23I and 59 Styryl-based compounds.
A,B) #23I and C,D) #59 were applied to N2a/22L for 72 hrs at 0.5, 1.0, 2.5, 5, 10, and 20 µM. A,C) Blots represent proteinase-K digested cell lysates detected with 6D11 anti-PrP monoclonal antibody. Bands respresent di-, mono-, and non-glycosylated isoforms at approximately 28, 23 and 17 kDa respectively. B,D) Bar graph representations of percent PrPSc infectivity compared to non-treated control (N2a/22L). B) #23I reduced PrPSc levels by 98.4%, 88.1%, 86.5%, 73.5%, 67.2% and 56.4%. D) #59 reduced PrPSc levels by 96.8%, 92.4%, 85.4%, 79.5%, 73.9% and 54.0%. Differences are significant by One-way ANOVA (**p = 0.0011), and *p<0.05 Newman-Keuls post-hoc analysis versus N2a/22L as indicated on the graph.

