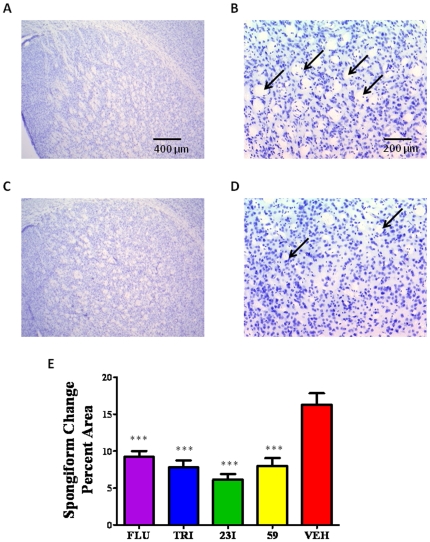
Figure 9. Quantitation of Spongiform Change.
Spongiform density. Spongiform change in the basal ganglia of all groups were quantified using Bioquant NovaPrime image analysis. Histological sections were stained with cresyl violet. A,B) Represent a section of basal ganglia of non-treated control animals at 25× and 100× magnification respectively. C,D) Represent a treatment group (fluphenazine) at 25× and 100× magnification. Arrows are highlighting vacuoles representing spongiform change. E) Bar graph representation of spongiform density quantification of all animal groups. Graphs were plotted as percent spongiform change per area. All treatment groups had significantly lower levels of spongiform density compared to non-treated control; ***p<0.0001 by One-way ANOVA; *p<0.05 Newman-Keuls post-hoc analysis versus N2a/22L as indicated on the graph.

