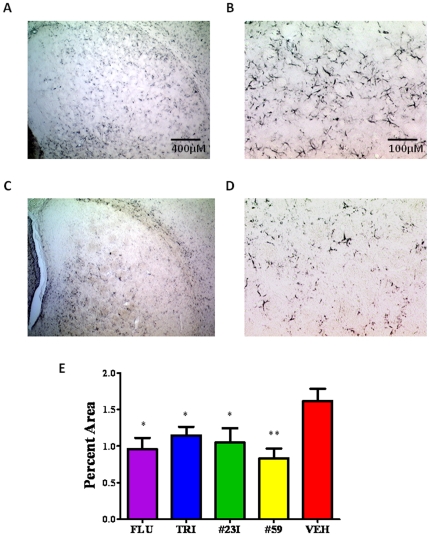
Figure 10. GFAP Immunoreactivity as a Measure of Astrocytosis.
Histological sections immunostained with anti-GFAP polyclonal antibody were quantified using Bioquant NovaPrime image analysis. A,B) Histological representation of non-treated control animal at 25× and 100× magnification, respectively (scale bars corresponding to 100 and 400 µm are shown). C,D) Shows representative sections from a treatment group (#23I) at 25× and 100× magnification. E) Shows a bar graph of the immunoreactivity quantitation for all groups. Graphs were plotted as percent immunoreactivity per area. Differences were significant by One-way ANOVA; p = 0.0073.

