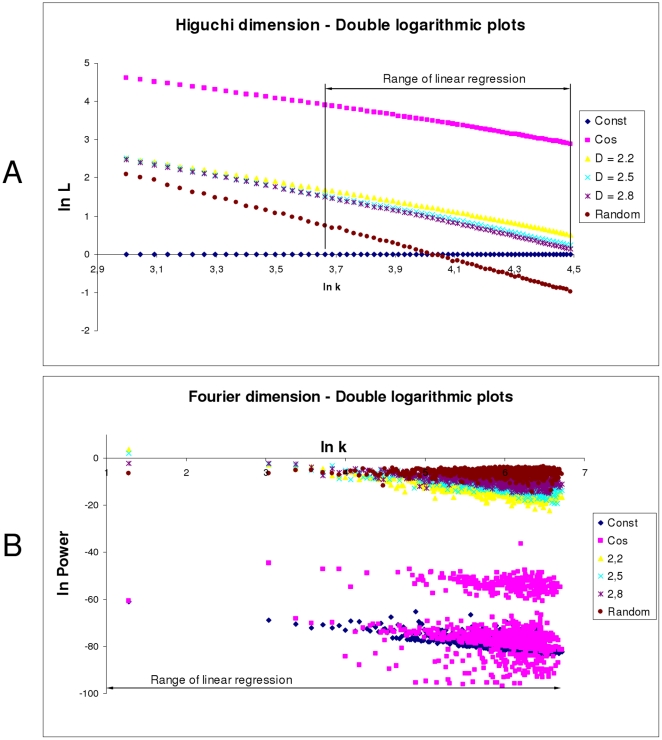
Figure 2. Double logarithmic plots of the Higuchi and Fourier dimension.
The individual ranges of linear regressions are depicted. A The slopes of the Higuchi dimension show a slight tendency for two linear regions. Thus, the range of linear regression was limited to the second linear region in order to gain the best absolute dimension values. The linear regression fit the data very well, with coefficients of determination R2 higher than 0.993. B The plot data of the Fourier dimension are highly dispersed. The coefficients of determination R2 were about 0.332. The highest value was 0.664.

