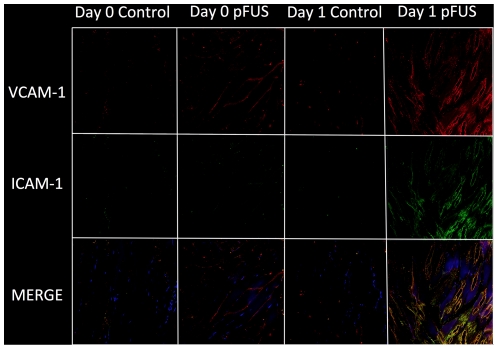
Figure 9. Expression of ICAM-1 and VCAM-1 in muscle tissue on days 0 and 1 following pFUS.
Blue represents DAPI stained nuclei, green represents ICAM-1, red represents VCAM-1, and yellow represents merged ICAM-1 and VCAM-1. Compared to control, there is slight increase of VCAM-1 on day 0 and dramatic increase of both ICAM-1 and VCAM-1 on day 1 post-pFUS.

