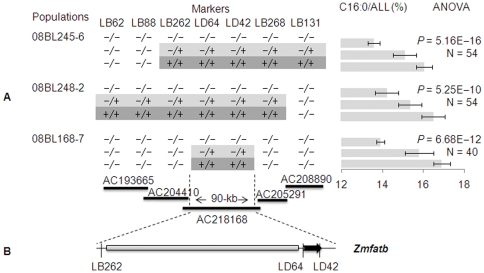
Figure 2. Narrowing down of QTL-Pal9 to a 90-kb genomic region.
(A) Progeny tests in BC3S2∶3 of three lines to compare the three recombinant classes that delimited QTL-Pal9 to the region between LB262 and LB268. Progeny tests compared palmitic acid concentrations (C16∶0/ALL) using ANOVA to find significant differences between the three genotype classes. The black thicker lines represent BAC clones with their accession number in NCBI. −/−, −/+ and +/+ is the homozygous allele of B73, allele that are heterozygous for B73 and By804 and homozygous allele of By804, respectively. (B) Bioinformatics analysis of the target region, which contains only one gene, Zmfatb (the black arrow). The grey boxes represent repetitive sequences.

