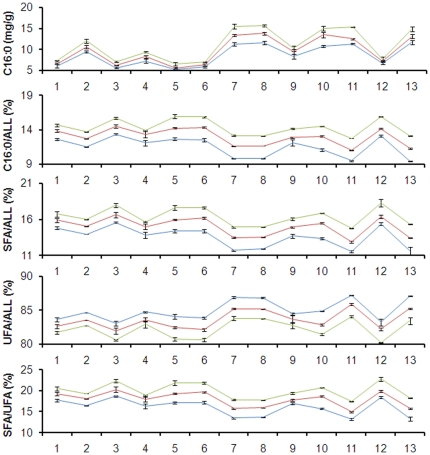
Figure 7. Genetic effects of the 11-bp InDel for the five palmitic acid–related traits in 13 different genetic backgrounds.
The y axis represents the variation in levels of C16∶0, C16∶0/ALL, SFA/ALL, UFA/ALL and SFA/UFA. The different segregating populations are shown along the x axis (1–11, F2 populations; 12 and 13, BC1S2 populations): 1, 7784-4Ht × 832; 2, 7784-4Ht × Sy1035; 3, Mo17 × Ji63; 4, By4839 × Mo17; 5, 832 × Shen5003; 6, Shen5003 × U8112; 7, By813 × By804; 8, By4839 × By815; 9, 4F1 × By4839; 10, By815 × By804; 11, By804 × By815; 12, (7784-4Ht × 832) ×7784-4Ht and 13, (By804 × By815) ×By804. Blue, red and Green lines represent the homozygous allele of B73, the heterozygous allele, and the homozygous allele of By804 based on the 11-bp InDel, respectively.

