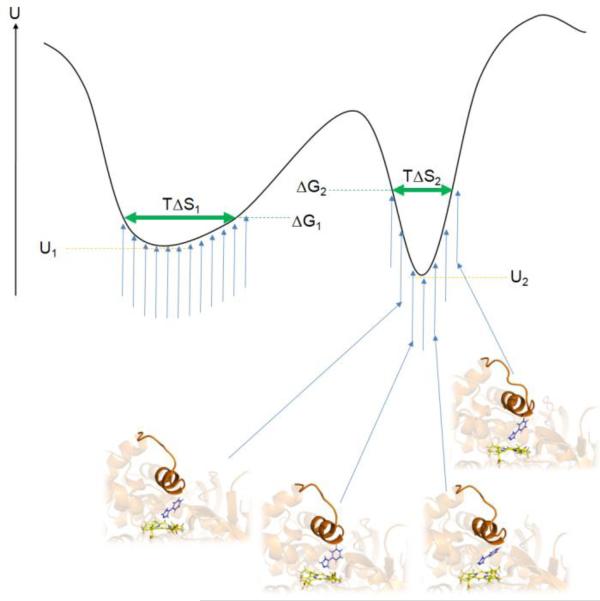
Figure 6.
Model of the potential energy U of a protein-ligand system of two different binding modes corresponding to the two energy minima. For each binding mode, the protein-ligand system samples slightly different configurations (blue vertical arrows and four selected protein-ligand snapshots of one binding mode). The left local minimum with a shallow shape (minimum potential energy U1) allows for more flexibility of the protein-ligand system and a smaller loss of configurational entropy compared to the steeper right minimum (minimum potential energy U2) and consequently has a lower free energy ΔG1 than the right minimum (ΔG2). Neglecting configurational entropy would cause the binding mode corresponding to the right minimum to be predicted as the top-ranked binding pose in disagreement with the real free-energy values. The vertical blue arrows represent possible protein-ligand conformations at a given temperature T. The horizontal green arrows represent the remaining configurational entropy of the system in the two different binding modes, TΔS1 and TΔS2.

