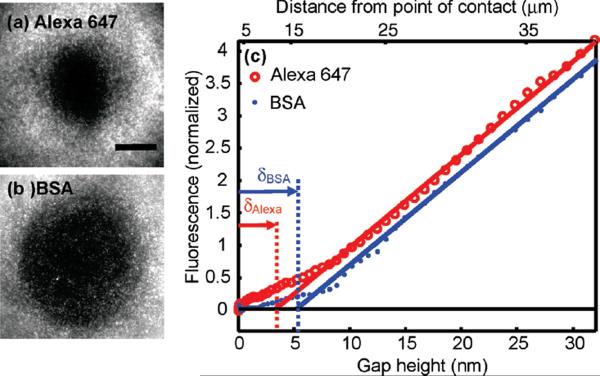
Figure 5.
Measuring the size of small molecules by their physical exclusion. Fluorescence images of (a) Alexa 647 (d ~ 1 nm; C0 = 50 nM) and (b) BSA labeled with Alexa 488; (d ~ 3 nm; C0 = 300 nM) under the same conditions. The BSA is excluded from a larger region than is the free dye. Scale bar 20 μm. (c) Normalized fluorescence profiles of BSA from (c) and a separate measurement of Alexa 647. Linear fits to I(h) performed at h > 10 nm yield δBSA = 5.2 ± 4 nm and δAlexa= 3.4 ± 3 nm.

