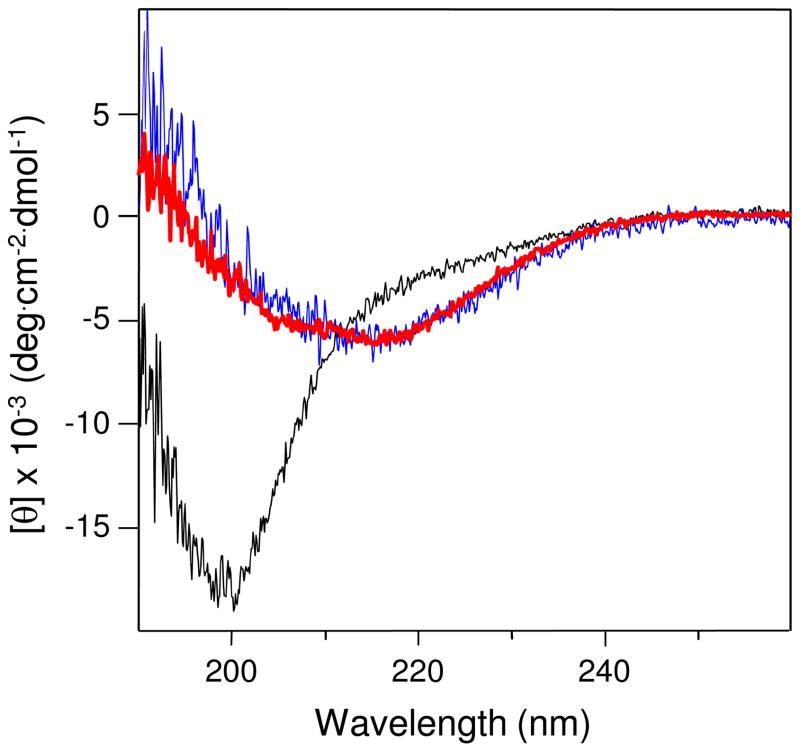
Figure 3.
CD spectra of cross-linked Aα221-610 oligomers (red), monomeric Aα221-610 fragment (black), and Aα392-610 oligomers (blue), all in 20 mM Tris, pH 7.4, containing 0.15 M NaCl; fragment concentrations were 0.5–1.0 mg/mL. All spectra were obtained in 0.01 cm cuvette at 4 °C and are representative of at least two experiments.

