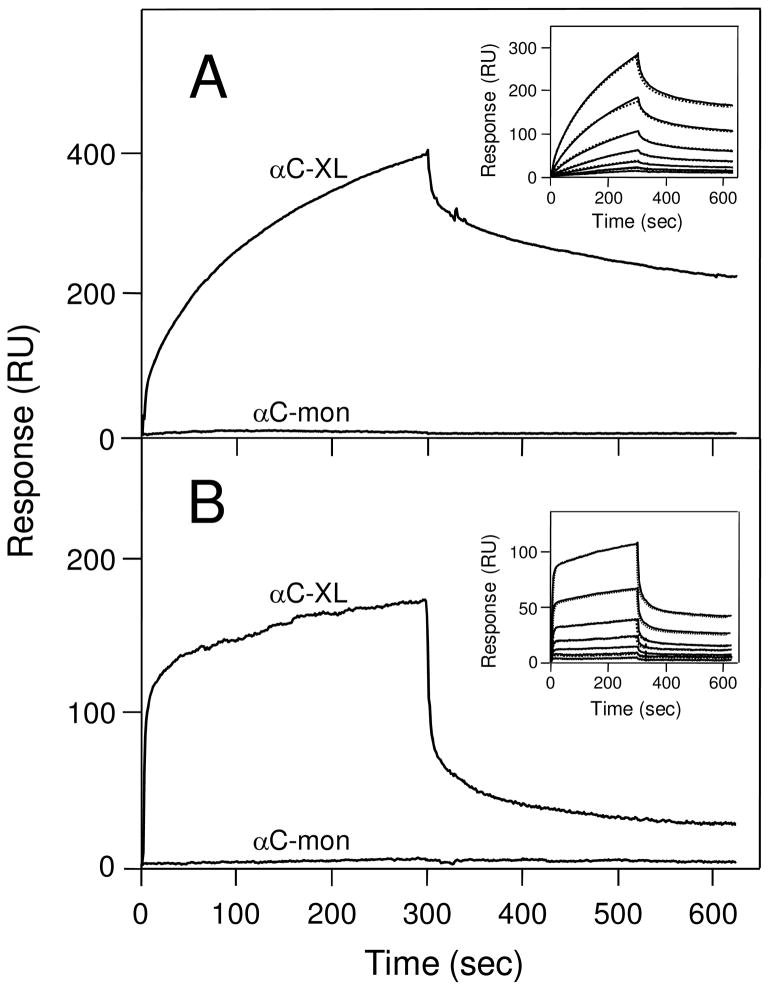
Figure 7.
Analysis of the interaction of plasminogen and tPA with immobilized Aα221-610 monomer and cross-linked Aα221-610 oligomers by surface plasmon resonance. Plasminogen (panel A) or tPA (panel B), each at 2 μM, was added to immobilized cross-linked Aα221-610 oligomers (αC-XL) or Aα221-610 monomer (αC-mon) and their association/dissociation was monitored in real time. The insets in panels A and B show concentration-dependent binding of plasminogen and tPA, respectively, each added at 16, 32, 63, 125, 250, 500 and 1000 nM, to immobilized cross-linked Aα221-610 oligomers; the dotted curves in both insets that practically coincide with the solid curves represent the best fit of the data using the kinetic analysis of the association/dissociation data (see Experimental Procedures).

