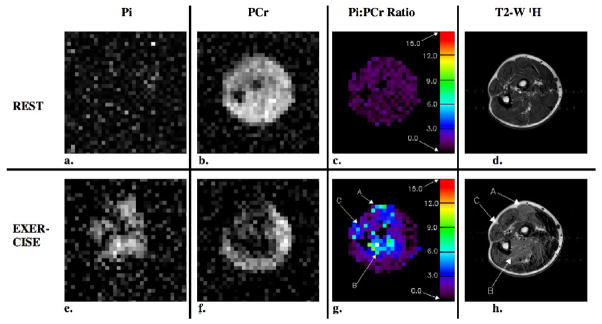
Figure 4.
Resting and exercise axial 31P and 1H images and Pi:PCr ratio maps that were acquired from the forearm of the same healthy volunteer as in Figure 3 using the interleaved single acquisition method. As in Figure 3, there is a spatial correspondence between elevated levels of Pi, reduced levels of PCr, increased Pi:PCr ratio and hyperintense signal in the 1H T2-W image. In this case, the subject also recruited muscle tissue in a new region (region C) during the exercise portion of the exam.

