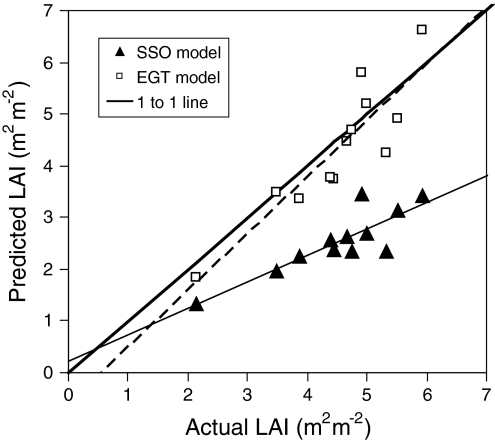
Fig. 1.
Predicted and measured LAI values for 12 herbaceous plant stands. Predictions were made using either SSO models (closed symbols) or EGT models (open symbols). Thick solid line is the one-to-one correspondence, the thin solid and dashed lines are the predicted and the measured regression lines for the SSO and EGT models, respectively. The following stands were studied: Sorghum bicolor, Oryza sativa, Amaranthus cruentus (all three at high and low N availability) and Glycine max (raw data from Anten et al. 1995b), Leersia hexandra, Hymenachne amplexicaulis, Paspalum fasciculatum and Hyparrhenia rufa (raw data taken from Anten et al. 1998). Figure redrawn from Anten (2002)

